Used Vehicle Value Index
Quarterly Conference Call
The next quarterly Manheim Used Vehicle Value Index (MUVVI) conference call is scheduled for Tuesday, Jul 8 at 11am ET.
Please RSVP to add the presentation to your calendar and see how to join.
Join Cox Automotive Chief Economist Jonathan Smoke, Jeremy Robb, senior director of Economic and Industry Insights, and Scott Vanner, Economic and Industry Insights analyst, as they discuss the latest Manheim Used Vehicle Value Index and the major economic and industry trends that shaped the quarter.
All questions related to the Manheim Used Vehicle Value Index and wholesale market can be sent to manheim.data@coxautoinc.com.
Listen to a recording of the last call.
View the Most Recent Presentation
The presentation will be available one hour before the conference call.
View Previous Presentations
By applying statistical analysis to its database of more than 5 million used vehicle transactions annually, Manheim has developed a measurement of used vehicle prices that is independent of underlying shifts in the characteristics of vehicles being sold. View the index methodology.
The Manheim Index is increasingly recognized by both financial and economic analysts as the premier indicator of pricing trends in the used vehicle market, but should not be considered indicative or predictive of any individual remarketer’s results.
Wholesale Used-Vehicle Prices Increase in the First Half of June
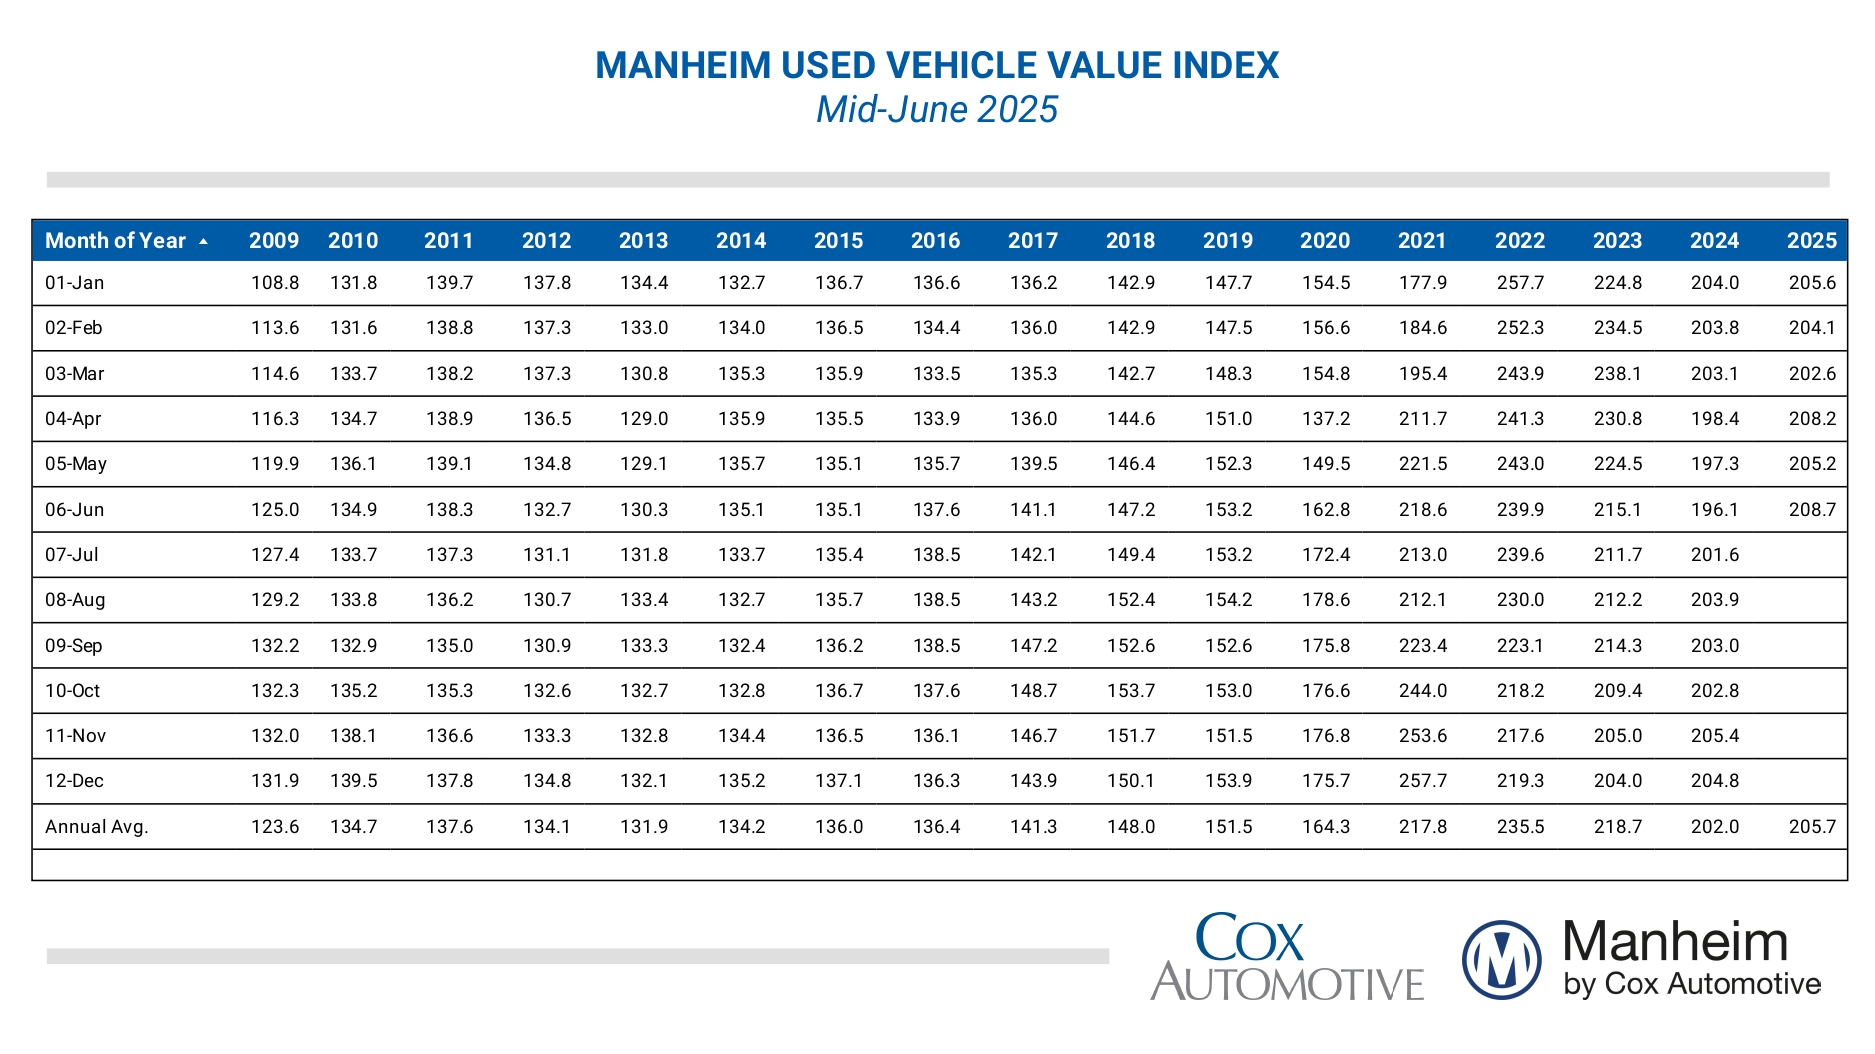
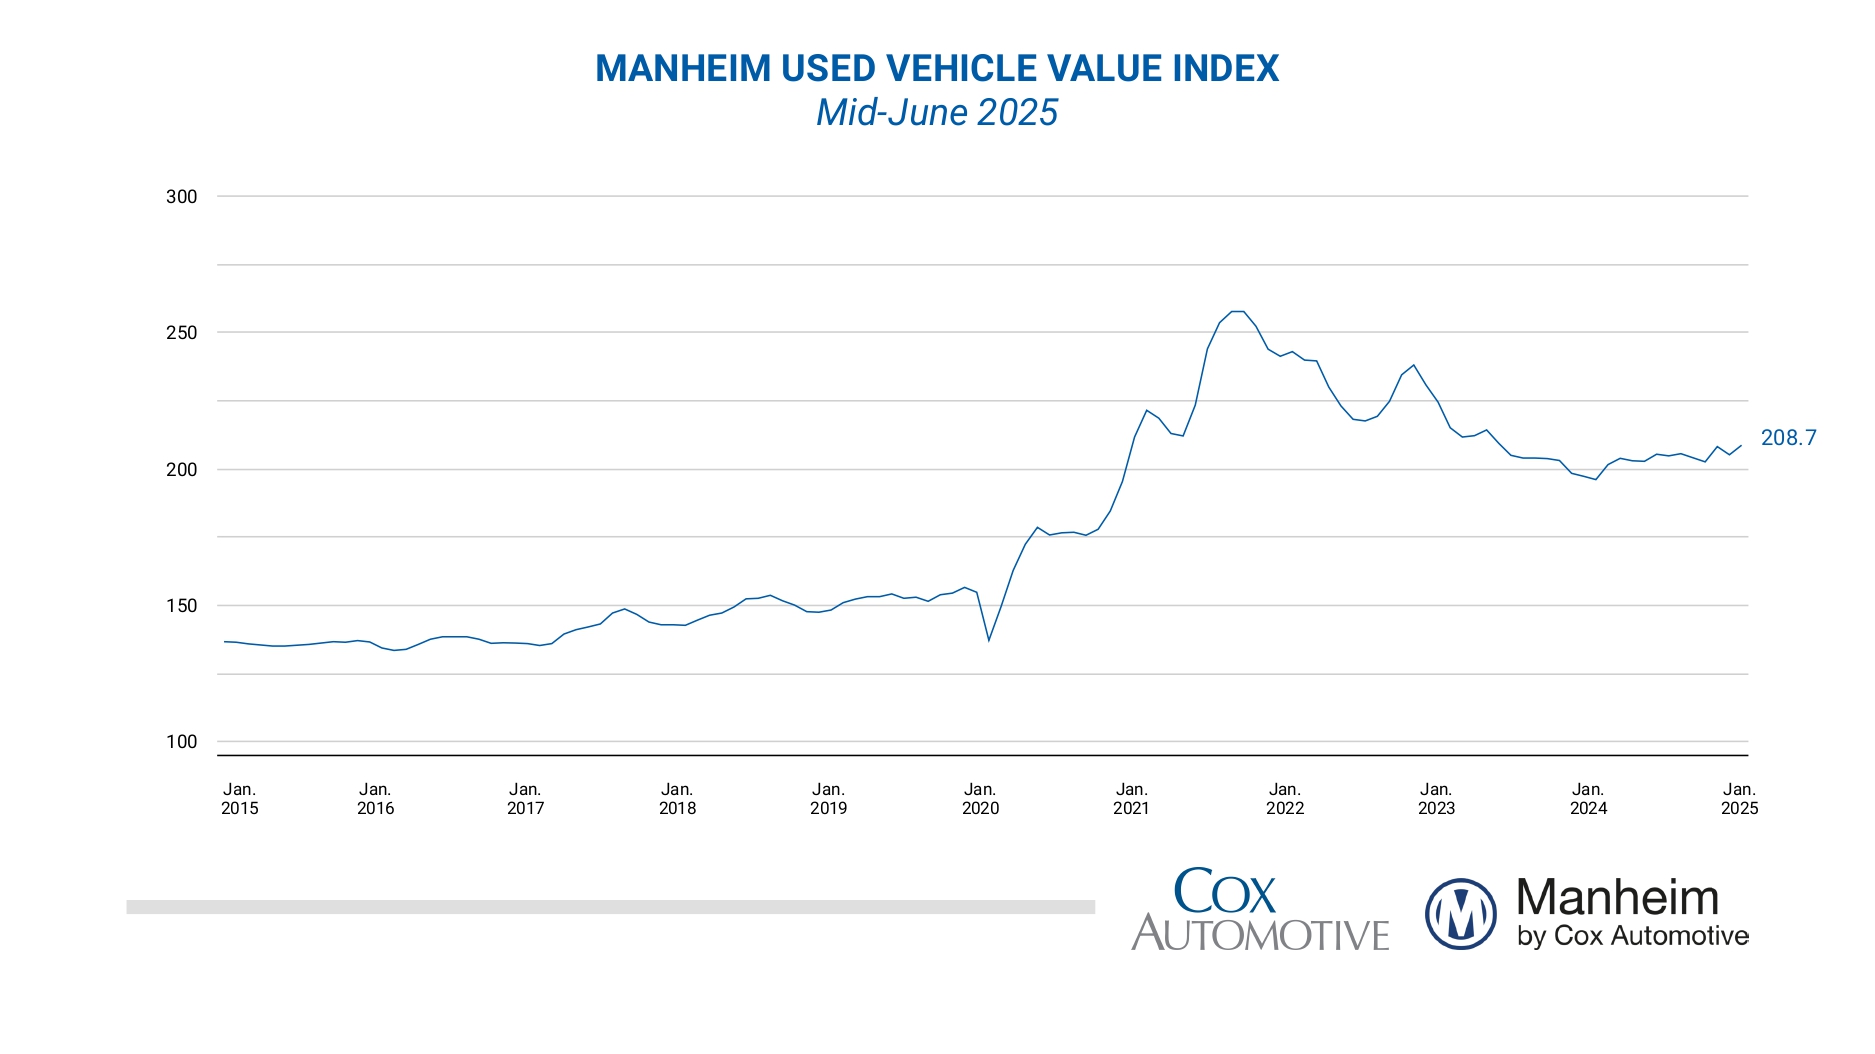
Wholesale used-vehicle prices (on a mix-, mileage-, and seasonally adjusted basis) increased from May in the first 15 days of June. The mid-month Manheim Used Vehicle Value Index rose 1.7% to 208.7, showing a rise of 6.5% from the full month of June 2024. The weaker seasonal adjustment drove the higher result for the index, following stronger adjustments in May. The non-adjusted price change in the first half of June decreased by 0.7% compared to May, and the unadjusted price is 5.6% higher year over year. The average move for the full month of June is a decline of 0.5 percentage points for non-adjusted values, indicating that the depreciation observed so far in June is slightly stronger than normally seen for the full month.
“While the wholesale market experienced some volatility in April and May, trends have started to calm down and are looking more normal early in June,” said Jeremy Robb, senior director of Economic and Industry Insights at Cox Automotive. “In the first two weeks of June, we’ve seen fairly normal depreciation trends on a weekly basis, as used retail sales remain steady. With heightened activity in April and May, the seasonal adjustments to the index were a bit stronger. Now that they are starting to wane, this has caused the overall index to rise so far in June. Wholesale supply continues to be relatively tight, and we’ve seen healthy sales conversion in recent weeks, suggesting market demand will be steady as we move into summer.”
Over the last two weeks, the Manheim Market Report (MMR) prices in the Three-Year-Old Index decreased by an aggregate of 0.4%, which aligns with the seasonally normal decline. The long-term average decrease for 3-year-old values in the first two weeks of June is 0.4%. Over the first 15 days of June, MMR Retention, the average difference in price relative to current MMR, averaged 99.2%, a rise of 0.1 percentage points, or one-tenth of a point, from late May, indicating that market prices remained slightly lower than valuation models early in June. MMR retention is approximately 1 percentage point higher compared to the first half of June 2024. The average daily sales conversion rate of 58.4% in the first half of the month was 2 points higher than the 56.4% recorded last year, indicating healthy demand levels in wholesale markets.

All major market segments saw positive year-over-year results for seasonally adjusted prices in the first half of June. Compared to the industry’s year-over-year increase of 6.5%, the luxury segment outperformed the market, rising by 8.8%. Rising less than the industry, SUVs were higher by 6.4%, with trucks showing gains of 3.9% and mid-size cars up by 3.3%. The compact car segment rose the least for the month, increasing by just 0.3% against the same time last year. All segments were higher compared with the results at the end of May. The overall industry increased by 1.7% compared to the prior month, and trucks were up even more, rising by 2.1% so far in June. Showing lower gains than the industry, both compact cars and SUVs increased by 1.5% against May, while mid-size cars rose by 1.3%. The luxury segment showed the smallest increase, higher by 1.2% over the period.
Electric vehicles (EVs) have experienced higher prices over the last couple of months, with a notable 11.1% increase in early June compared to somewhat depressed values in the same period last year. Prices in the non-EV segment were also higher, rising by 6.2% over the period. Against May values, EVs increased by 0.7% in the first half of June, while non-EVs showed stronger gains and were up 2.0% in the month.
Wholesale supply is down in mid-June. Leveraging Manheim sales and inventory data, wholesale supply ended May at an estimated 25 days, up one day from the end of April and down one day compared to May 2024. Wholesale supply remains slightly tighter for this time of year, running roughly two days lower than the longer-term levels for the same period. As of June 15, wholesale supply remained at 25 days, unchanged from the end of May, and was 6% or two days lower versus last year.
Measures of consumer sentiment were mixed in the first half of June. The initial June reading on Consumer Sentiment from the University of Michigan jumped 15.9% and was much stronger than expected. With the gain, the index recovered some of its decline since February, but it was still down 11.3% year over year. Views of both current conditions and expectations improved, but expectations improved the most. Expectations for inflation in one year declined to 5.1% from 6.6%, and expectations for inflation in five years decreased to 4.1% from 4.2%. Consumers’ views of buying conditions for vehicles increased to the best level since February. The daily index of consumer sentiment from Morning Consult shows a slight negative trend with data through June 16. After jumping 7.1% in May, the index is down 0.7% so far in June. Views of current conditions have improved, but future expectations declined in the first half of June. According to AAA, the average price of unleaded gasoline has decreased 0.1% as of June 15 but is down 9% year over year.