Used Vehicle Value Index
Quarterly Conference Call
The next quarterly Manheim Used Vehicle Value Index (MUVVI) conference call is scheduled for Tuesday, Jan 8 at 11am ET.
Please RSVP to add the presentation to your calendar and see how to join.
Join Cox Automotive Chief Economist Jonathan Smoke, Jeremy Robb, senior director of Economic and Industry Insights, and Scott Vanner, Economic and Industry Insights analyst, as they discuss the latest Manheim Used Vehicle Value Index and the major economic and industry trends that shaped the quarter.
All questions related to the Manheim Used Vehicle Value Index and wholesale market can be sent to manheim.data@coxautoinc.com.
Listen to a recording of the last call.
View the Most Recent Presentation
The presentation will be available one hour before the conference call.
View Previous Presentations
By applying statistical analysis to its database of more than 5 million used vehicle transactions annually, Manheim has developed a measurement of used vehicle prices that is independent of underlying shifts in the characteristics of vehicles being sold. View the index methodology.
The Manheim Index is increasingly recognized by both financial and economic analysts as the premier indicator of pricing trends in the used vehicle market, but should not be considered indicative or predictive of any individual remarketer’s results.
Wholesale Used-Vehicle Prices Decline in October
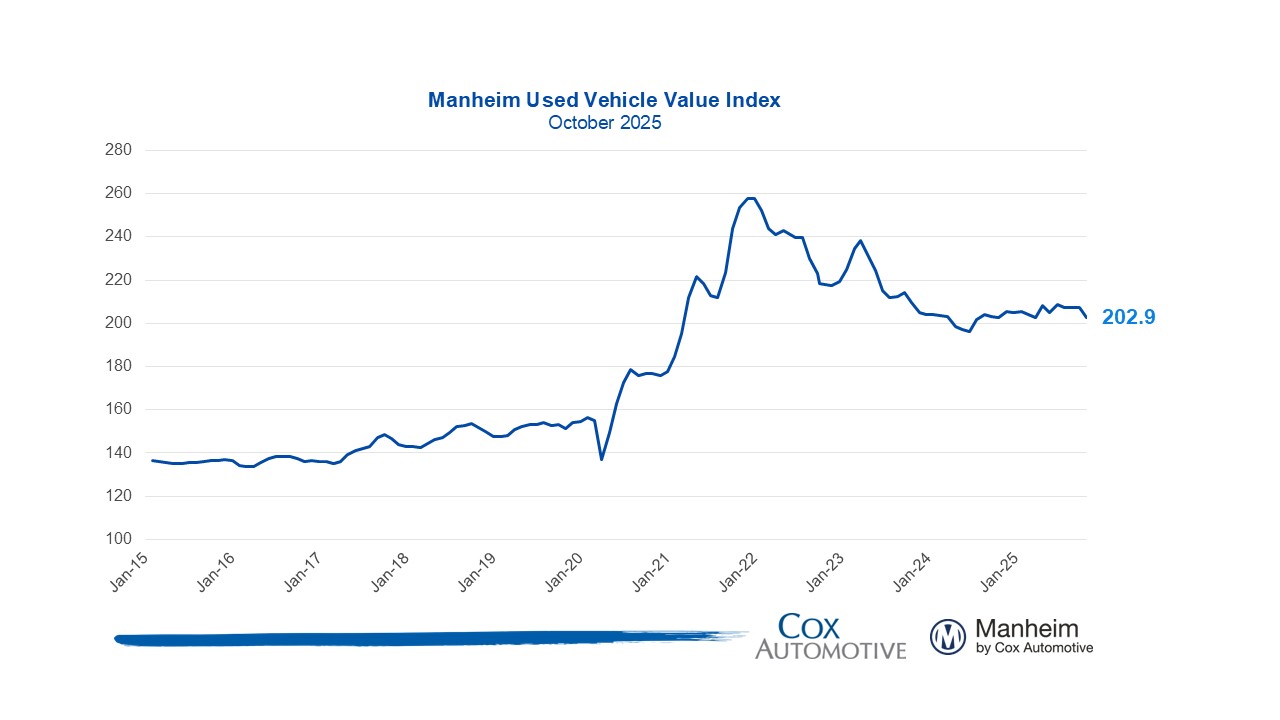
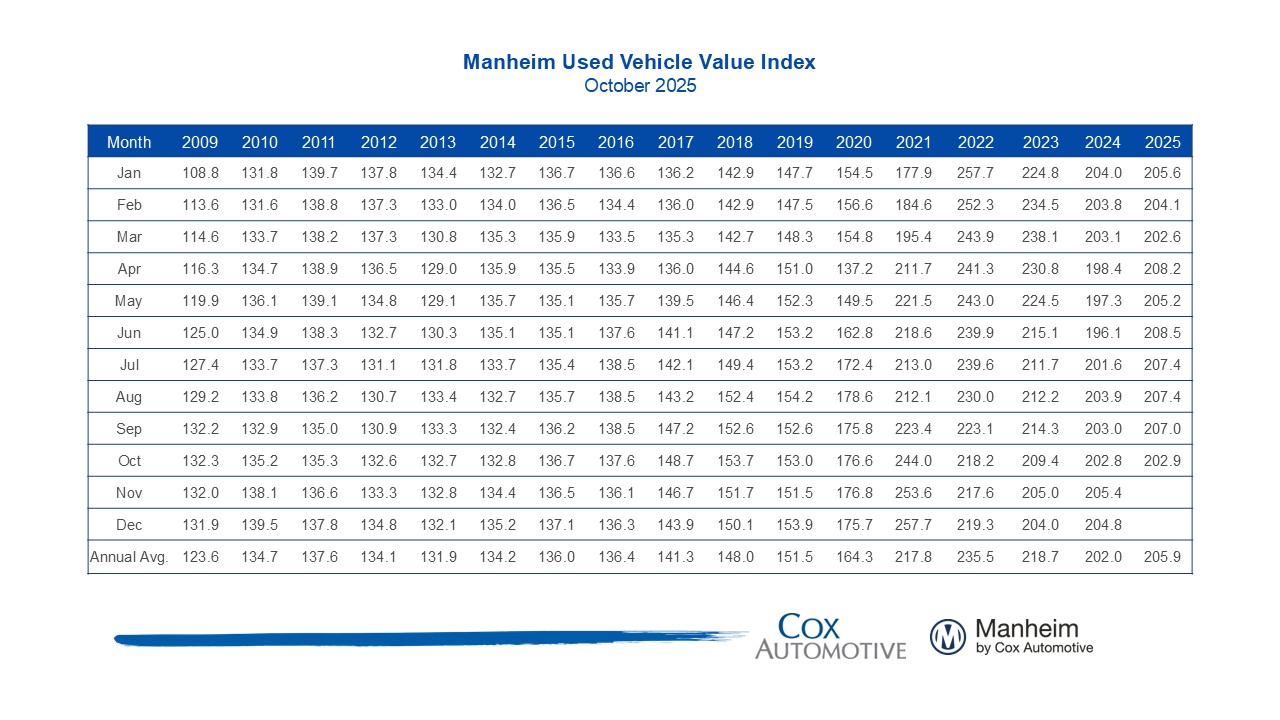
The Manheim Used Vehicle Value Index (MUVVI) dropped to 202.9, reflecting a 2.0% decline in October’s wholesale used-vehicle prices (adjusted for mix, mileage, and seasonality) compared to September. The index is mostly unchanged compared to October 2024. The long-term average monthly move for October is an increase of 0.3%, as the seasonal adjustment factor is typically the weakest of the year.
Non-adjusted wholesale vehicle prices fell 3.7% from September and are now 0.2% higher year over year, giving back some of the strength observed throughout most of this year. The long-term average monthly move in non-adjusted values is a decline of 1.5% in October.
Expert Perspective — Jeremy Robb, Deputy Chief Economist, Cox Automotive
“Trends get a little spooky in October for the wholesale markets, typically showing us the highest levels of depreciation in the year – and this year was no exception,” said Jeremy Robb, Deputy Chief Economist at Cox Automotive.
“It’s typical to see higher declines for values in October, as dealers slow down ahead of winter, and the new model year mix grows in retail inventory – both of which can put pressure on values. At the end of October, roughly 49% of all new vehicles on dealers’ lots were MY26s, and that’s higher than we usually see. When coupled with wholesale values that had declined very little so far this year, you can get more volatility.”
“As October progressed, used retail sales were higher each week, and we ended with tighter inventory levels. This led to slower rates of depreciation than normal in the last week of the month. With tighter days’ supply and solid demand, we may see lower depreciation trends for the rest of Q4. Consumers should see higher tax refunds next year and as more dealers catch wind of that, we could expect more demand at wholesale and retail earlier than usual next year.”
Prices, Retention & Sales Conversion
- MMR prices for the Three-Year-Old Index declined 2.3% in October.
- MMR retention averaged 99.0% in October, showing no change from September and down 10 basis points year over year.
- Sales conversion was 54.9% for the period, down more than two percentage points from September but still higher than the most recent three-year average.
Takeaway: MMR prices declined a bit less than the typical 2.5% decline for this period. MMR retention is generally in line with what is expected for this time of year. Meanwhile, sales conversion indicates a modest softening of demand as is normal at this time of year, but conversions remain higher than usual for this time of year.

Takeaway: The luxury vehicle segment outperformed the overall market as it has for several months, influenced by higher EV prices helping the segment. On the other hand, compact and mid-size cars continue to see the largest declines compared to last year.
EV versus Non-EV Index
- EVs: The Electric Vehicle (EV) Index was down 3.0% from September (post EV tax credit expiration), but up 3.9% year over year.
- Non-EVs: The Non-EV Index was down 2.2% from September and now down 0.1% year over year.
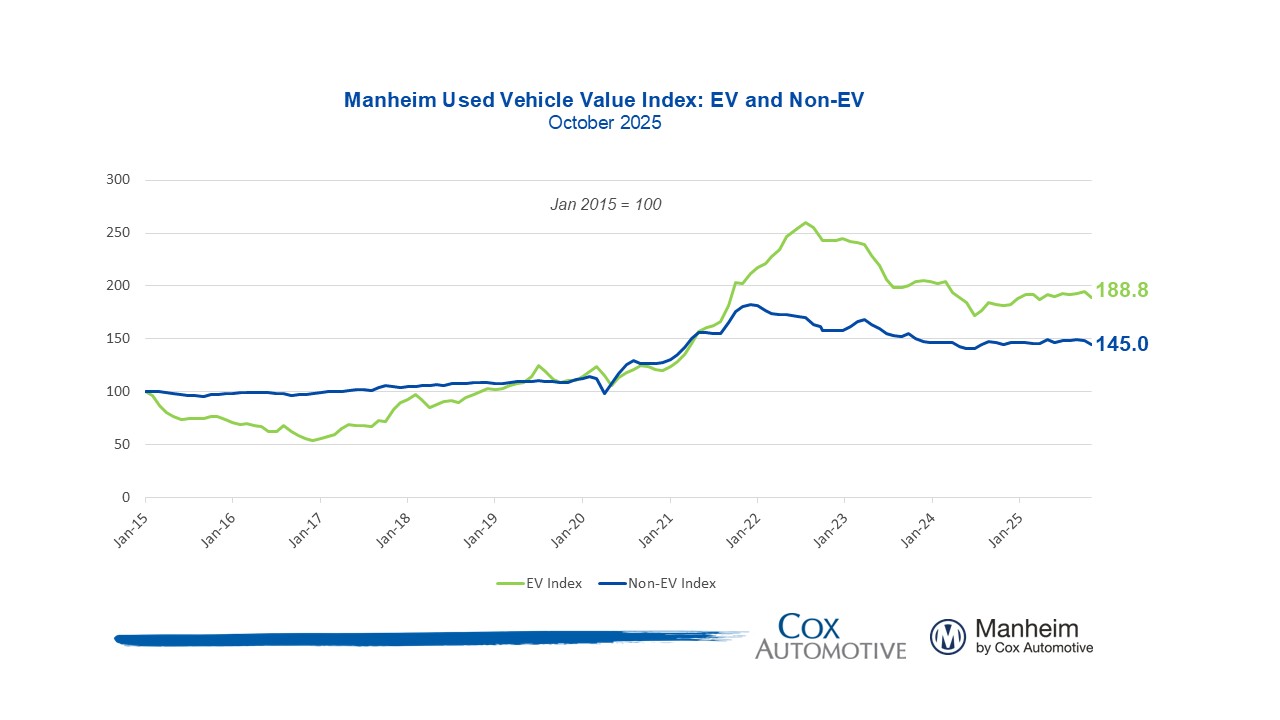
Takeaway: EV values are more volatile, reflecting changing incentives and consumer interest, but may remain higher as values were more depressed last year compared to the rest of the market.
Wholesale Supply
- At the end of October, wholesale days’ supply rose to 28 days, higher by two days compared to September, but lower by 1 day year over year
Takeaway: Wholesale used vehicle supply usually averages around 30 days, signaling market balance. In October, wholesale supply rose over the month but remained below average, suggesting that inventory may be harder to find, especially as retail demand continues to show strength.
The Manheim Used Vehicle Value Index (MUVVI) is a trusted benchmark for tracking wholesale used-vehicle prices in the U.S., which helps dealers and analysts gauge market shifts and anticipate retail trends. The official measure is reported on the fifth business day of each month. The next complete suite of monthly MUVVI data will be released on Dec. 5, 2025.
For questions or to request data, please email manheim.data@coxautoinc.com. If you want updates about the Manheim Used Vehicle Value Index, as well as direct invitations to the quarterly call sent to you, please sign up for our Cox Automotive newsletter and select Manheim Used Vehicle Value Index quarterly calls.
Note: The Manheim Used Vehicle Value Index was adjusted to improve accuracy and consistency across the data set as of the January 2023 data release. The starting point for the MUVVI was adjusted from January 1995 to January 1997. The index was then recalculated with January 1997 = 100, whereas prior reports had 1995 as the baseline of 100. All monthly and yearly percent changes since January 2015 are identical. Learn more about the decision to rebase the index .