Used Vehicle Value Index
Quarterly Conference Call
The next quarterly Manheim Used Vehicle Value Index (MUVVI) conference call is scheduled for Tuesday, Jan 8 at 11am ET.
Please RSVP to add the presentation to your calendar and see how to join.
Join Cox Automotive Interim Chief Economist, Jeremy Robb, and Scott Vanner, Economic and Industry Insights analyst, as they discuss the latest Manheim Used Vehicle Value Index and the major economic and industry trends that shaped the quarter.
All questions related to the Manheim Used Vehicle Value Index and wholesale market can be sent to manheim.data@coxautoinc.com.
Listen to a recording of the last call.
View the Most Recent Presentation
The presentation will be available one hour before the conference call.
View Previous Presentations
By applying statistical analysis to its database of more than 5 million used vehicle transactions annually, Manheim has developed a measurement of used vehicle prices that is independent of underlying shifts in the characteristics of vehicles being sold. View the index methodology.
The Manheim Index is increasingly recognized by both financial and economic analysts as the premier indicator of pricing trends in the used vehicle market, but should not be considered indicative or predictive of any individual remarketer’s results.
Manheim Used Vehicle Value Index: Mid-December 2025 Trends
- Manheim Used Vehicle Value Index (MUVVI) increased to 206.0, reflecting a 0.3% increase in wholesale used-vehicle prices (adjusted for mix, mileage, and seasonality) in the first 15 days of December compared to November, and a 0.6% increase compared to December 2024. Seasonally adjusted wholesale values typically show no change over the full month on average.
- Non-adjusted wholesale vehicle prices fell 0.2% in the first half of December from November and are up 0.7% year over year. The long-term average monthly move in non-adjusted values is typically an increase of 0.3% for the full month of December.

Expert Perspective — Jeremy Robb, Interim Chief Economist, Cox Automotive
“As we wind down the year, the wholesale market is showing fairly seasonal patterns of price movement: a welcome effect following a volatile year. The seasonal adjustment factor was weaker than usual, causing the overall index to rise more than typically seen this month. With two weeks left in the year and many people shifting focus to the holidays, we are likely to see activity at Manheim slow down slightly – which is normal. Last week, the Fed cut rates for the third time this year, which appears to be the right move in hindsight as the employment picture continues to soften marginally. It takes time for auto loan APRs to see the impact from those cuts, but we would expect to see a bit of an impact on consumer financing soon. When you couple lower interest rates with higher credit availability and an expectation of a stronger tax refund season, the auto market could have a little wind in its sails as we embark on 2026.”
MMR Prices, Retention & Sales Conversion
- MMR prices for the Three-Year-Old Index declined 0.5% in the first 15 days of December.
- MMR retention averaged 99.7% in the first half of December, higher by 0.7 points year over year and up 0.8 points from November.
- Sales conversion averaged 59.1% in the first half of December, higher by 6 points year over year and up 6.7 points from November.
Takeaway: MMR depreciation rates were a bit elevated against long-term rates early in December. MMR retention is a bit above longer-term run rates, while sales conversion indicates demand is seasonally strong at Manheim.
Segment Performance: Year-Over-Year Price Changes
Prices in the overall market rose 0.6% year over year, supported by price growth in the luxury vehicle segment from electric vehicles.

Takeaway: The luxury vehicle segment continues to outperform the overall market and is influenced by the trend for EVs, while trucks and compact cars saw the largest declines.
EV versus Non-EV Index
- EVs: The Electric Vehicle (EV) Index was up 2.1% year over year but was down 0.5% from November.
- Non-EVs: The Non-EV Index was up 0.6% year over year, and it is up 0.2% from November.
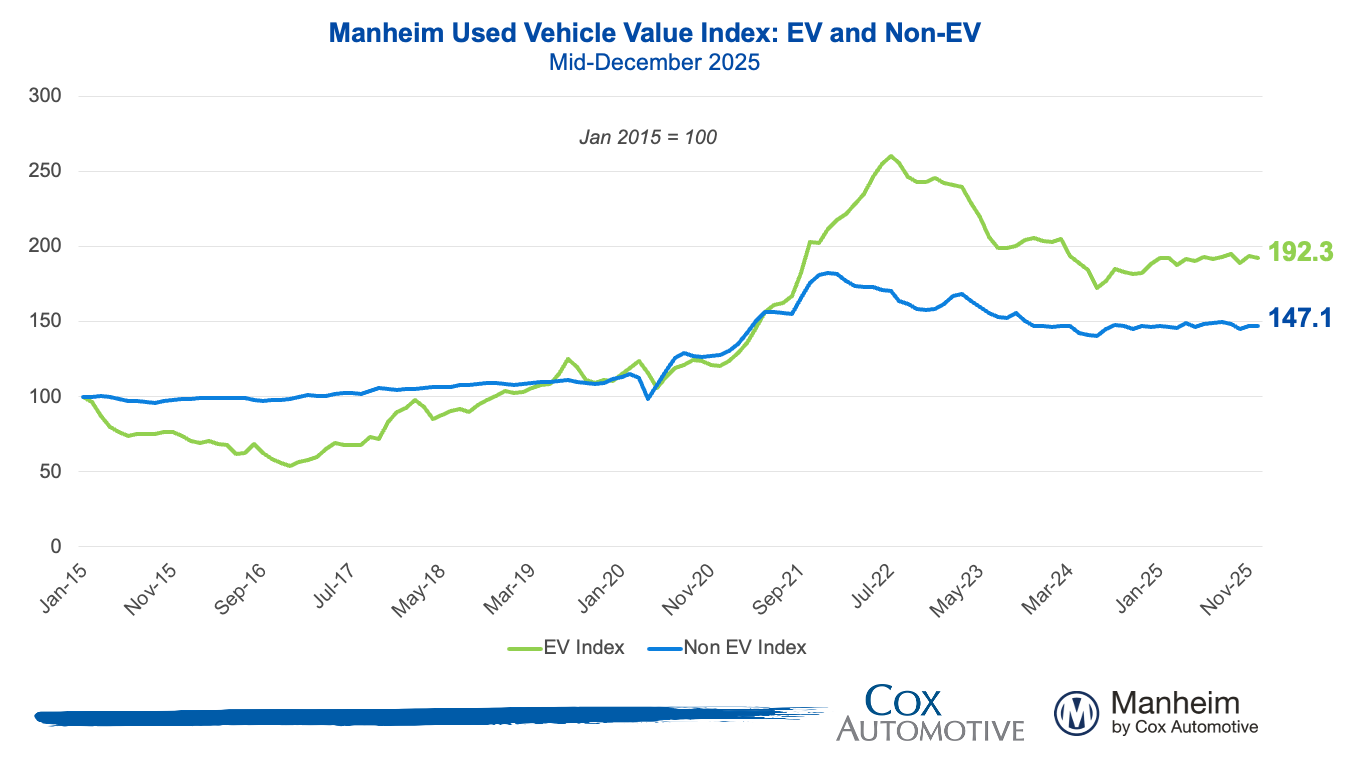
Takeaway: EV values continued to soften following the expiration of EV tax credits but remain strong year over year.
Wholesale Supply
- At the end of November, wholesale vehicle supply reached 30.5 days, up 1.7 days against November 2024 and increasing from 28 days at the end of October. As of Dec. 15, days’ supply fell by 0.6 days to 29.9 days.
Takeaway: Wholesale used vehicle supply usually starts to rise in the last quarter of the calendar year, as more holiday periods slow the pace of sales. Inventory levels have risen a bit more than the pace of sales against last year, but days’ supply remains fairly balanced.

The Manheim Used Vehicle Value Index (MUVVI) is a trusted benchmark for tracking wholesale used-vehicle prices in the U.S., which helps dealers and analysts gauge market shifts and anticipate retail trends. The official measure is reported on the fifth business day of each month. The next complete suite of monthly MUVVI data will be released on Jan. 8, 2026.
For questions or to request data, please email manheim.data@coxautoinc.com. If you want updates about the Manheim Used Vehicle Value Index, as well as direct invitations to the quarterly call sent to you, please sign up for our Cox Automotive newsletter and select Manheim Used Vehicle Value Index quarterly calls.
Note: The Manheim Used Vehicle Value Index was adjusted to improve accuracy and consistency across the data set as of the January 2023 data release. The starting point for the MUVVI was adjusted from January 1995 to January 1997. The index was then recalculated with January 1997 = 100, whereas prior reports had 1995 as the baseline of 100. All monthly and yearly percent changes since January 2015 are identical. Learn more about the decision to rebase the index.